OpenRouter, concept 2026
Show it, don’t say it.
- Role
- Design and engineering
- Timeline
- October 2026
- Team
- Solo
- Status
- Unofficial concept
Why
OpenRouter has the numbers. The page should show them.
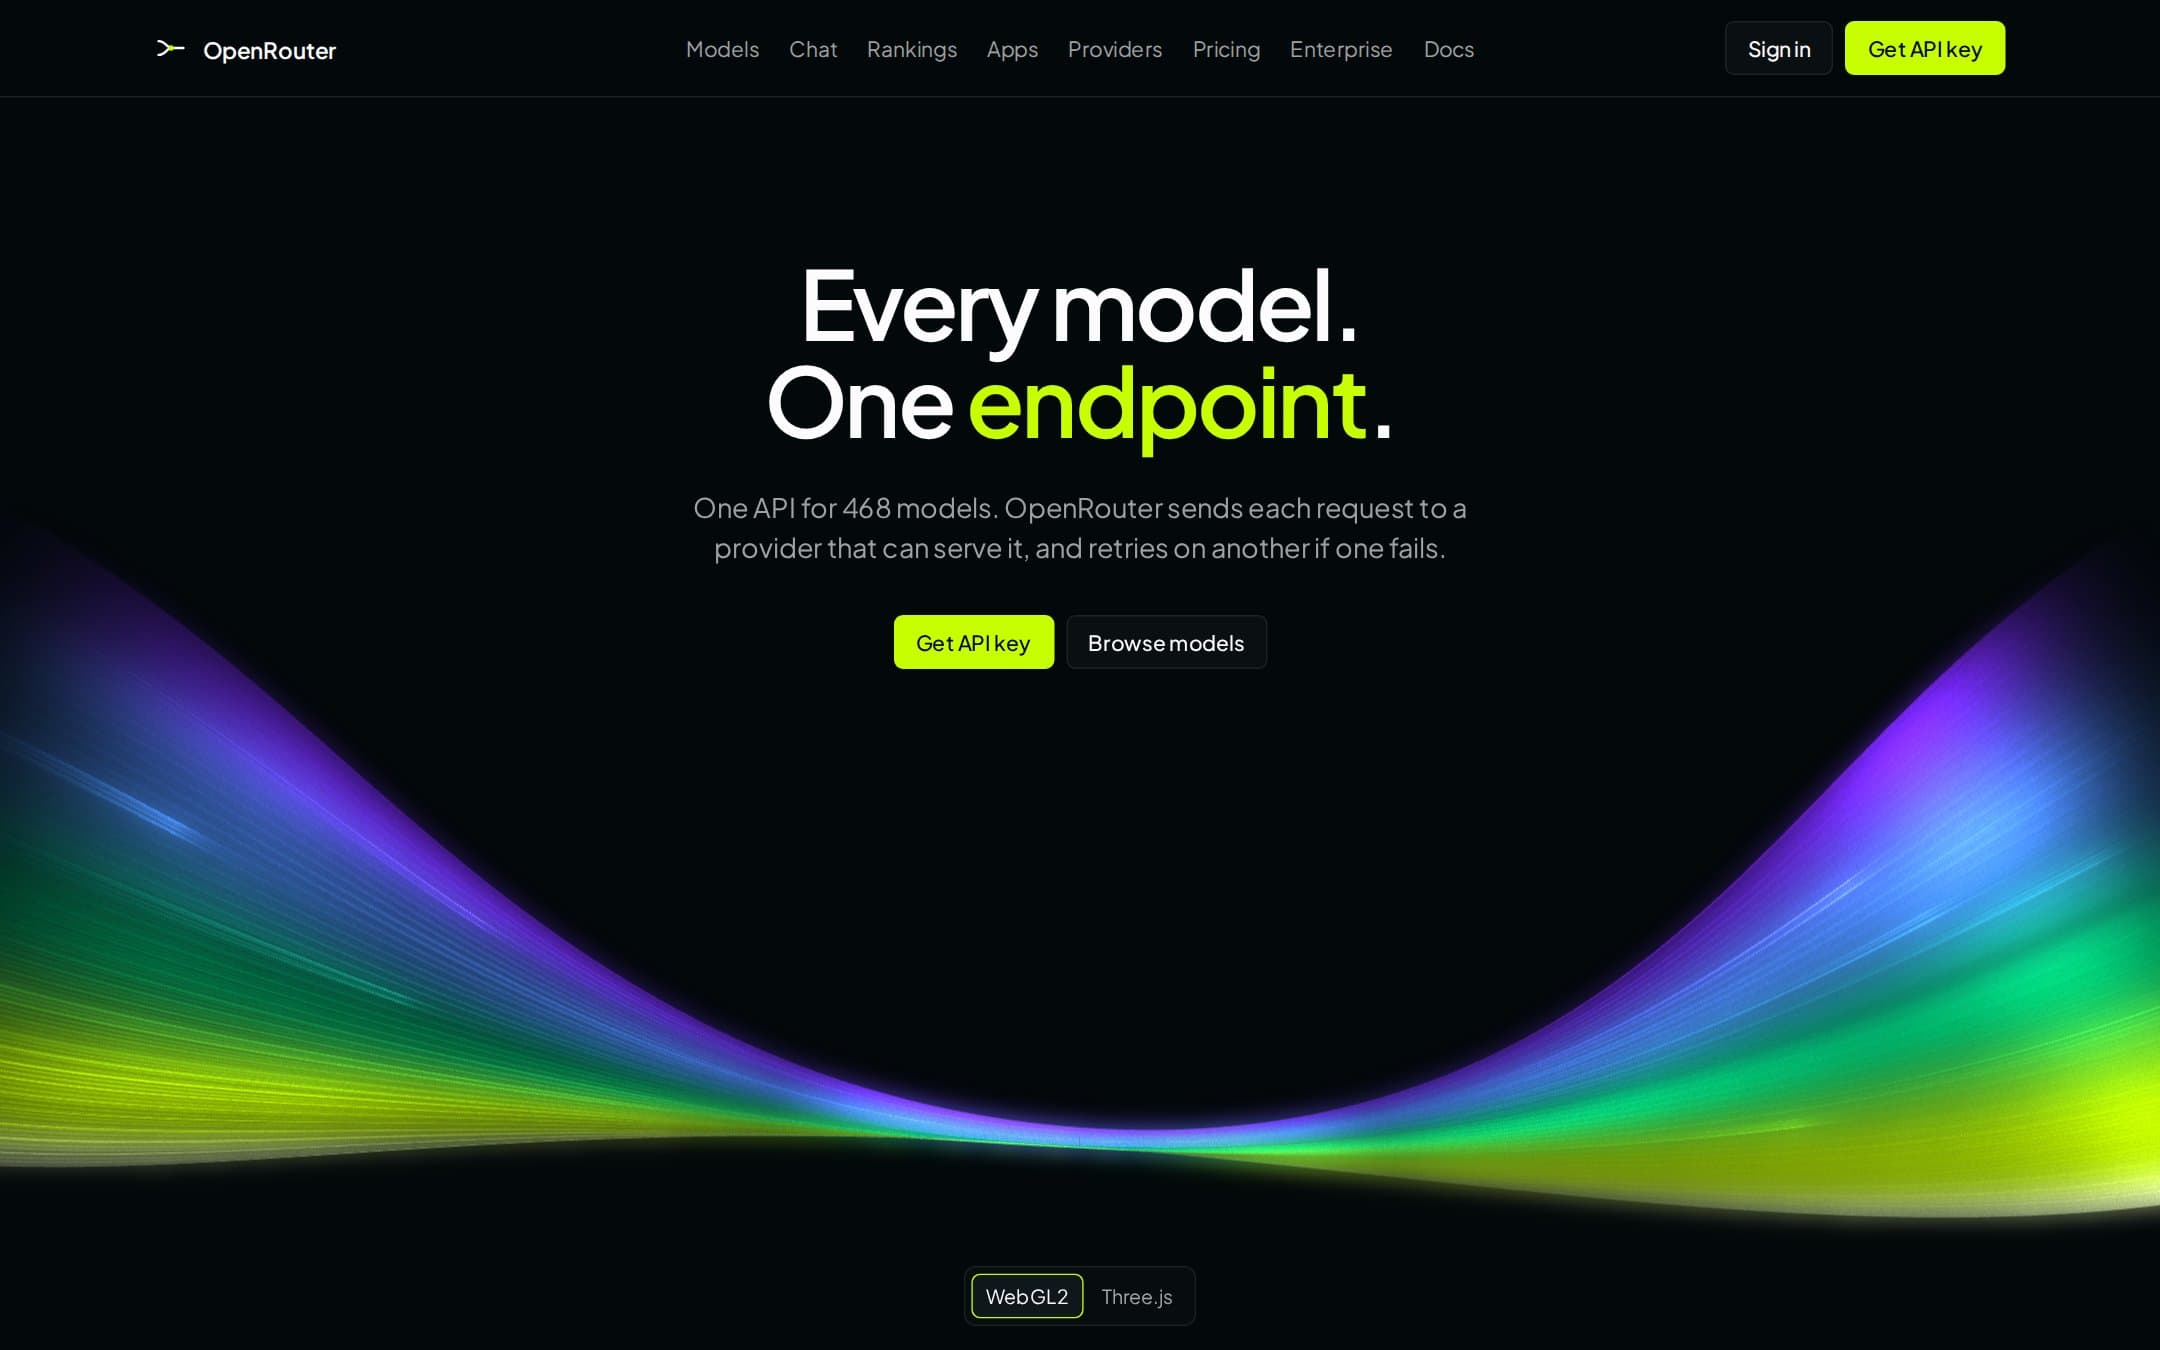
Hundreds of models, a hundred providers, trillions of tokens a week. I wanted the landing to show that, not just say it.
The hero
A ribbon that is the product.
Many lines come in wide and merge into one in the middle: many models, one endpoint. I tried five placements and kept the first.
The data
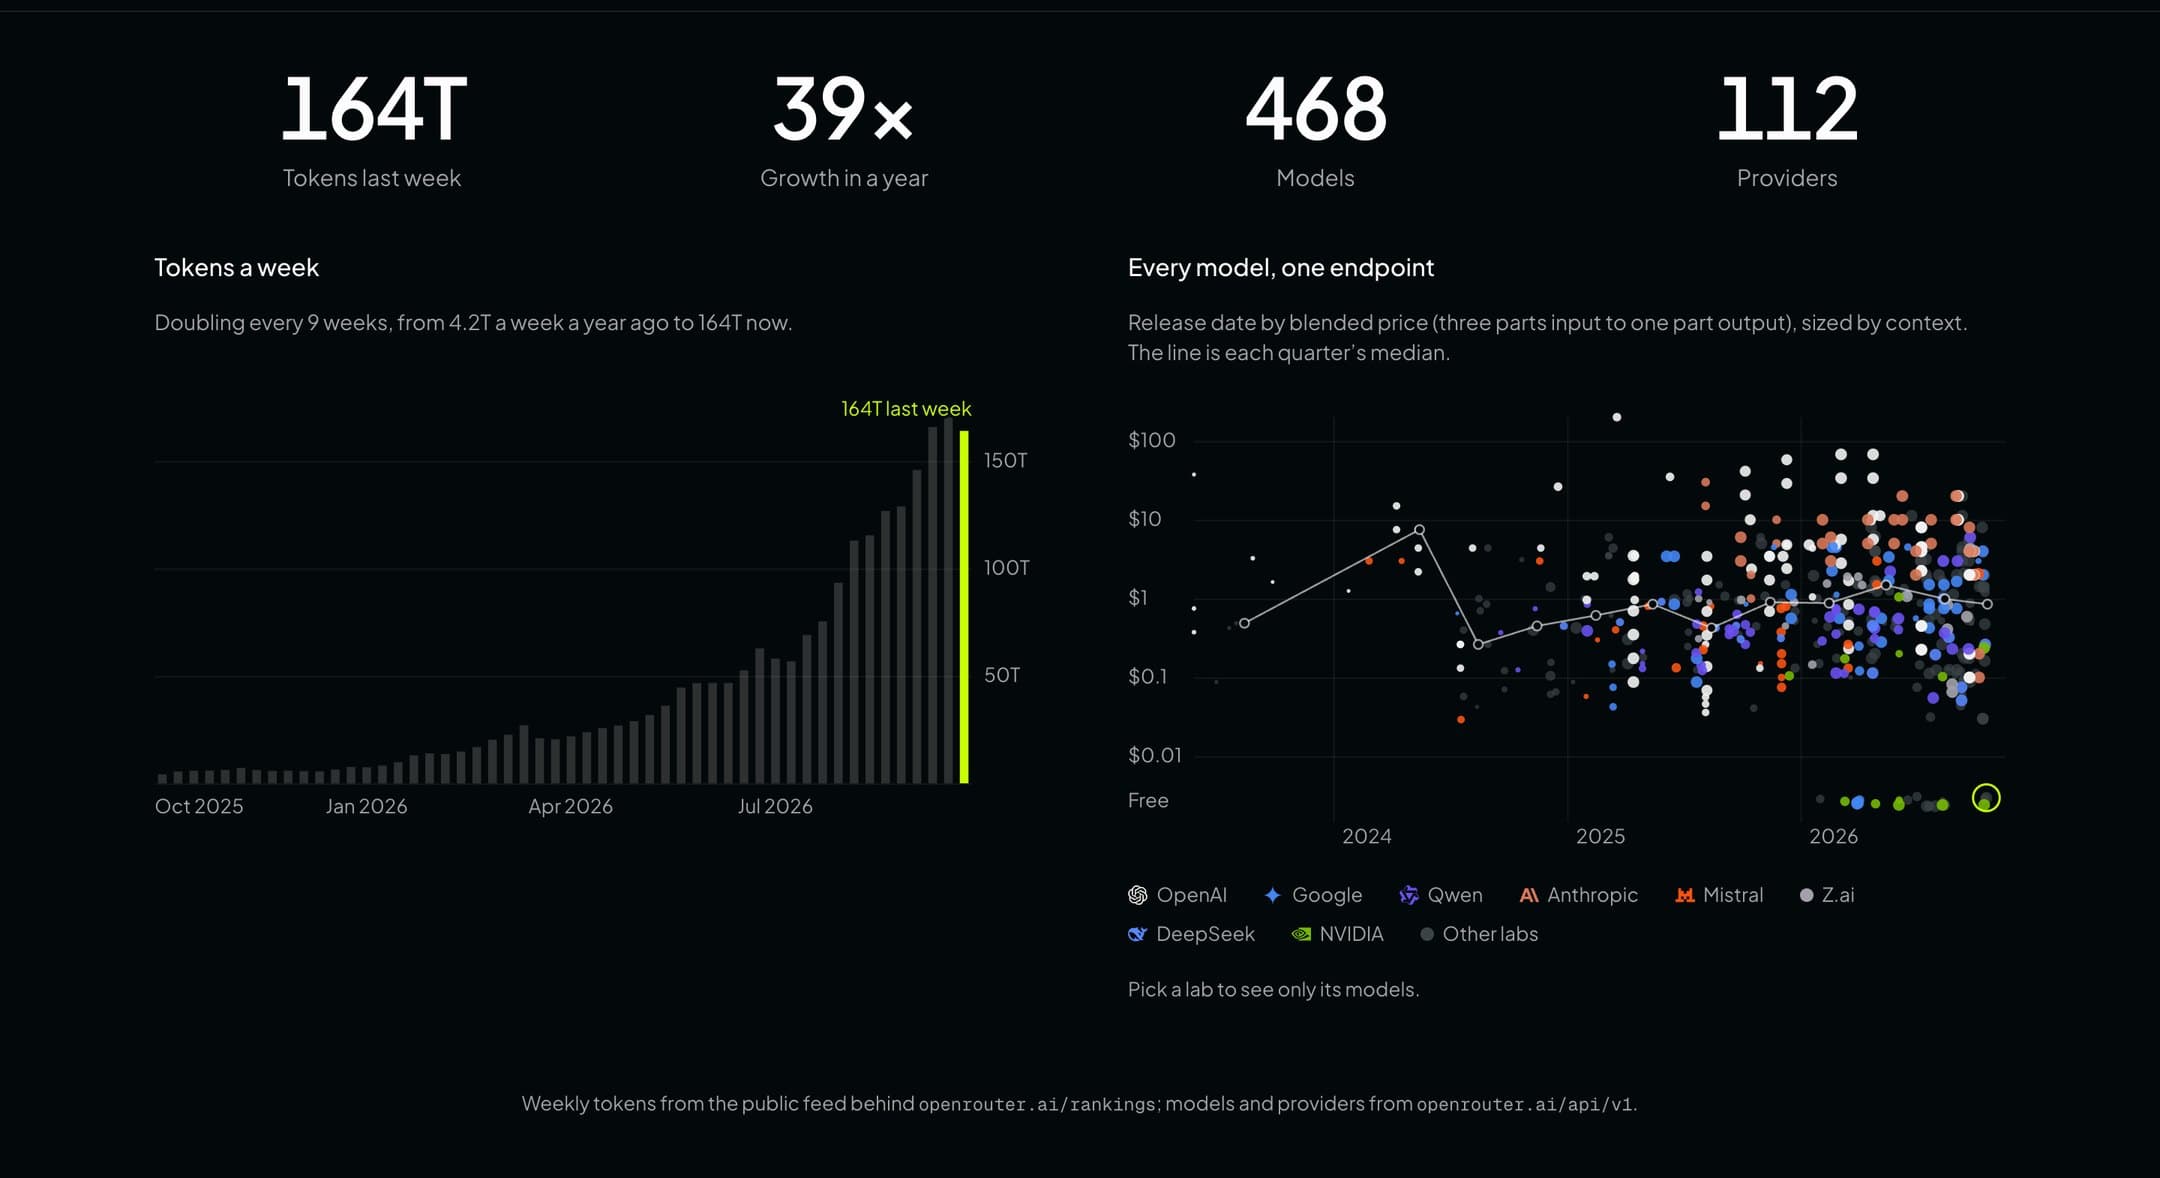
Live numbers, read like a benchmark site.
Tokens a week and every model by release date and price, from OpenRouter's own feed. Pick a lab and only its models stay lit.
Iteration
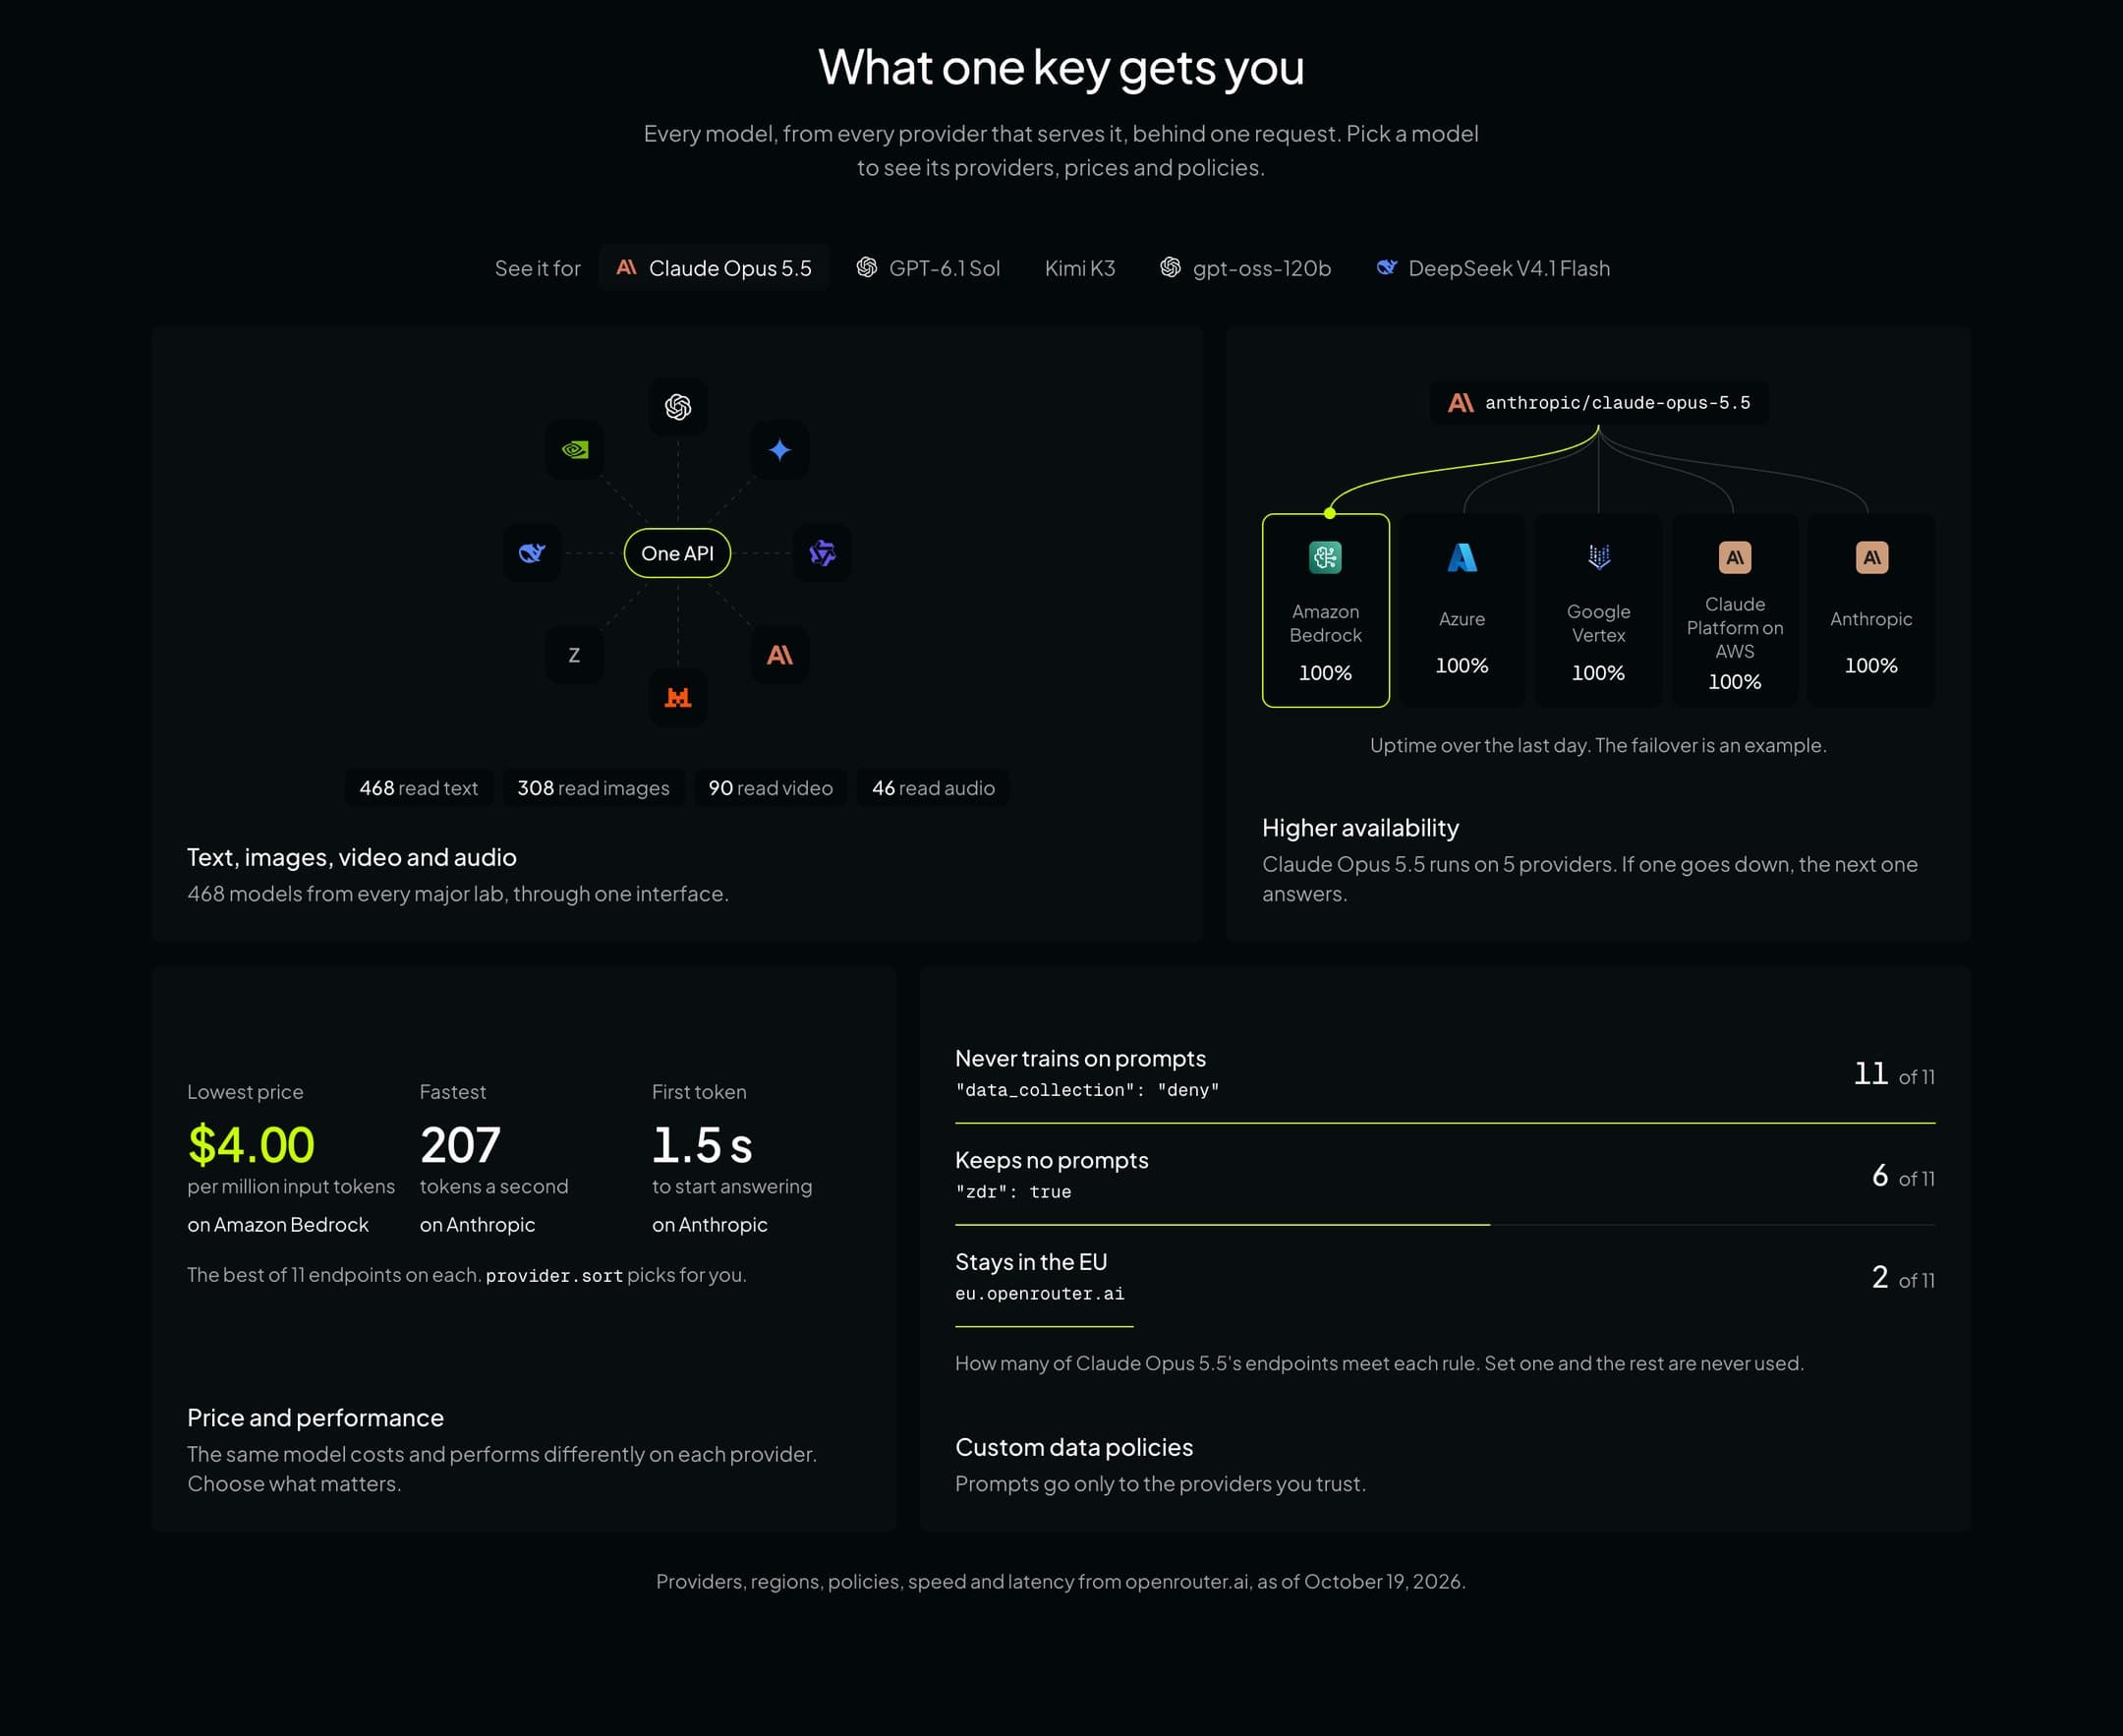
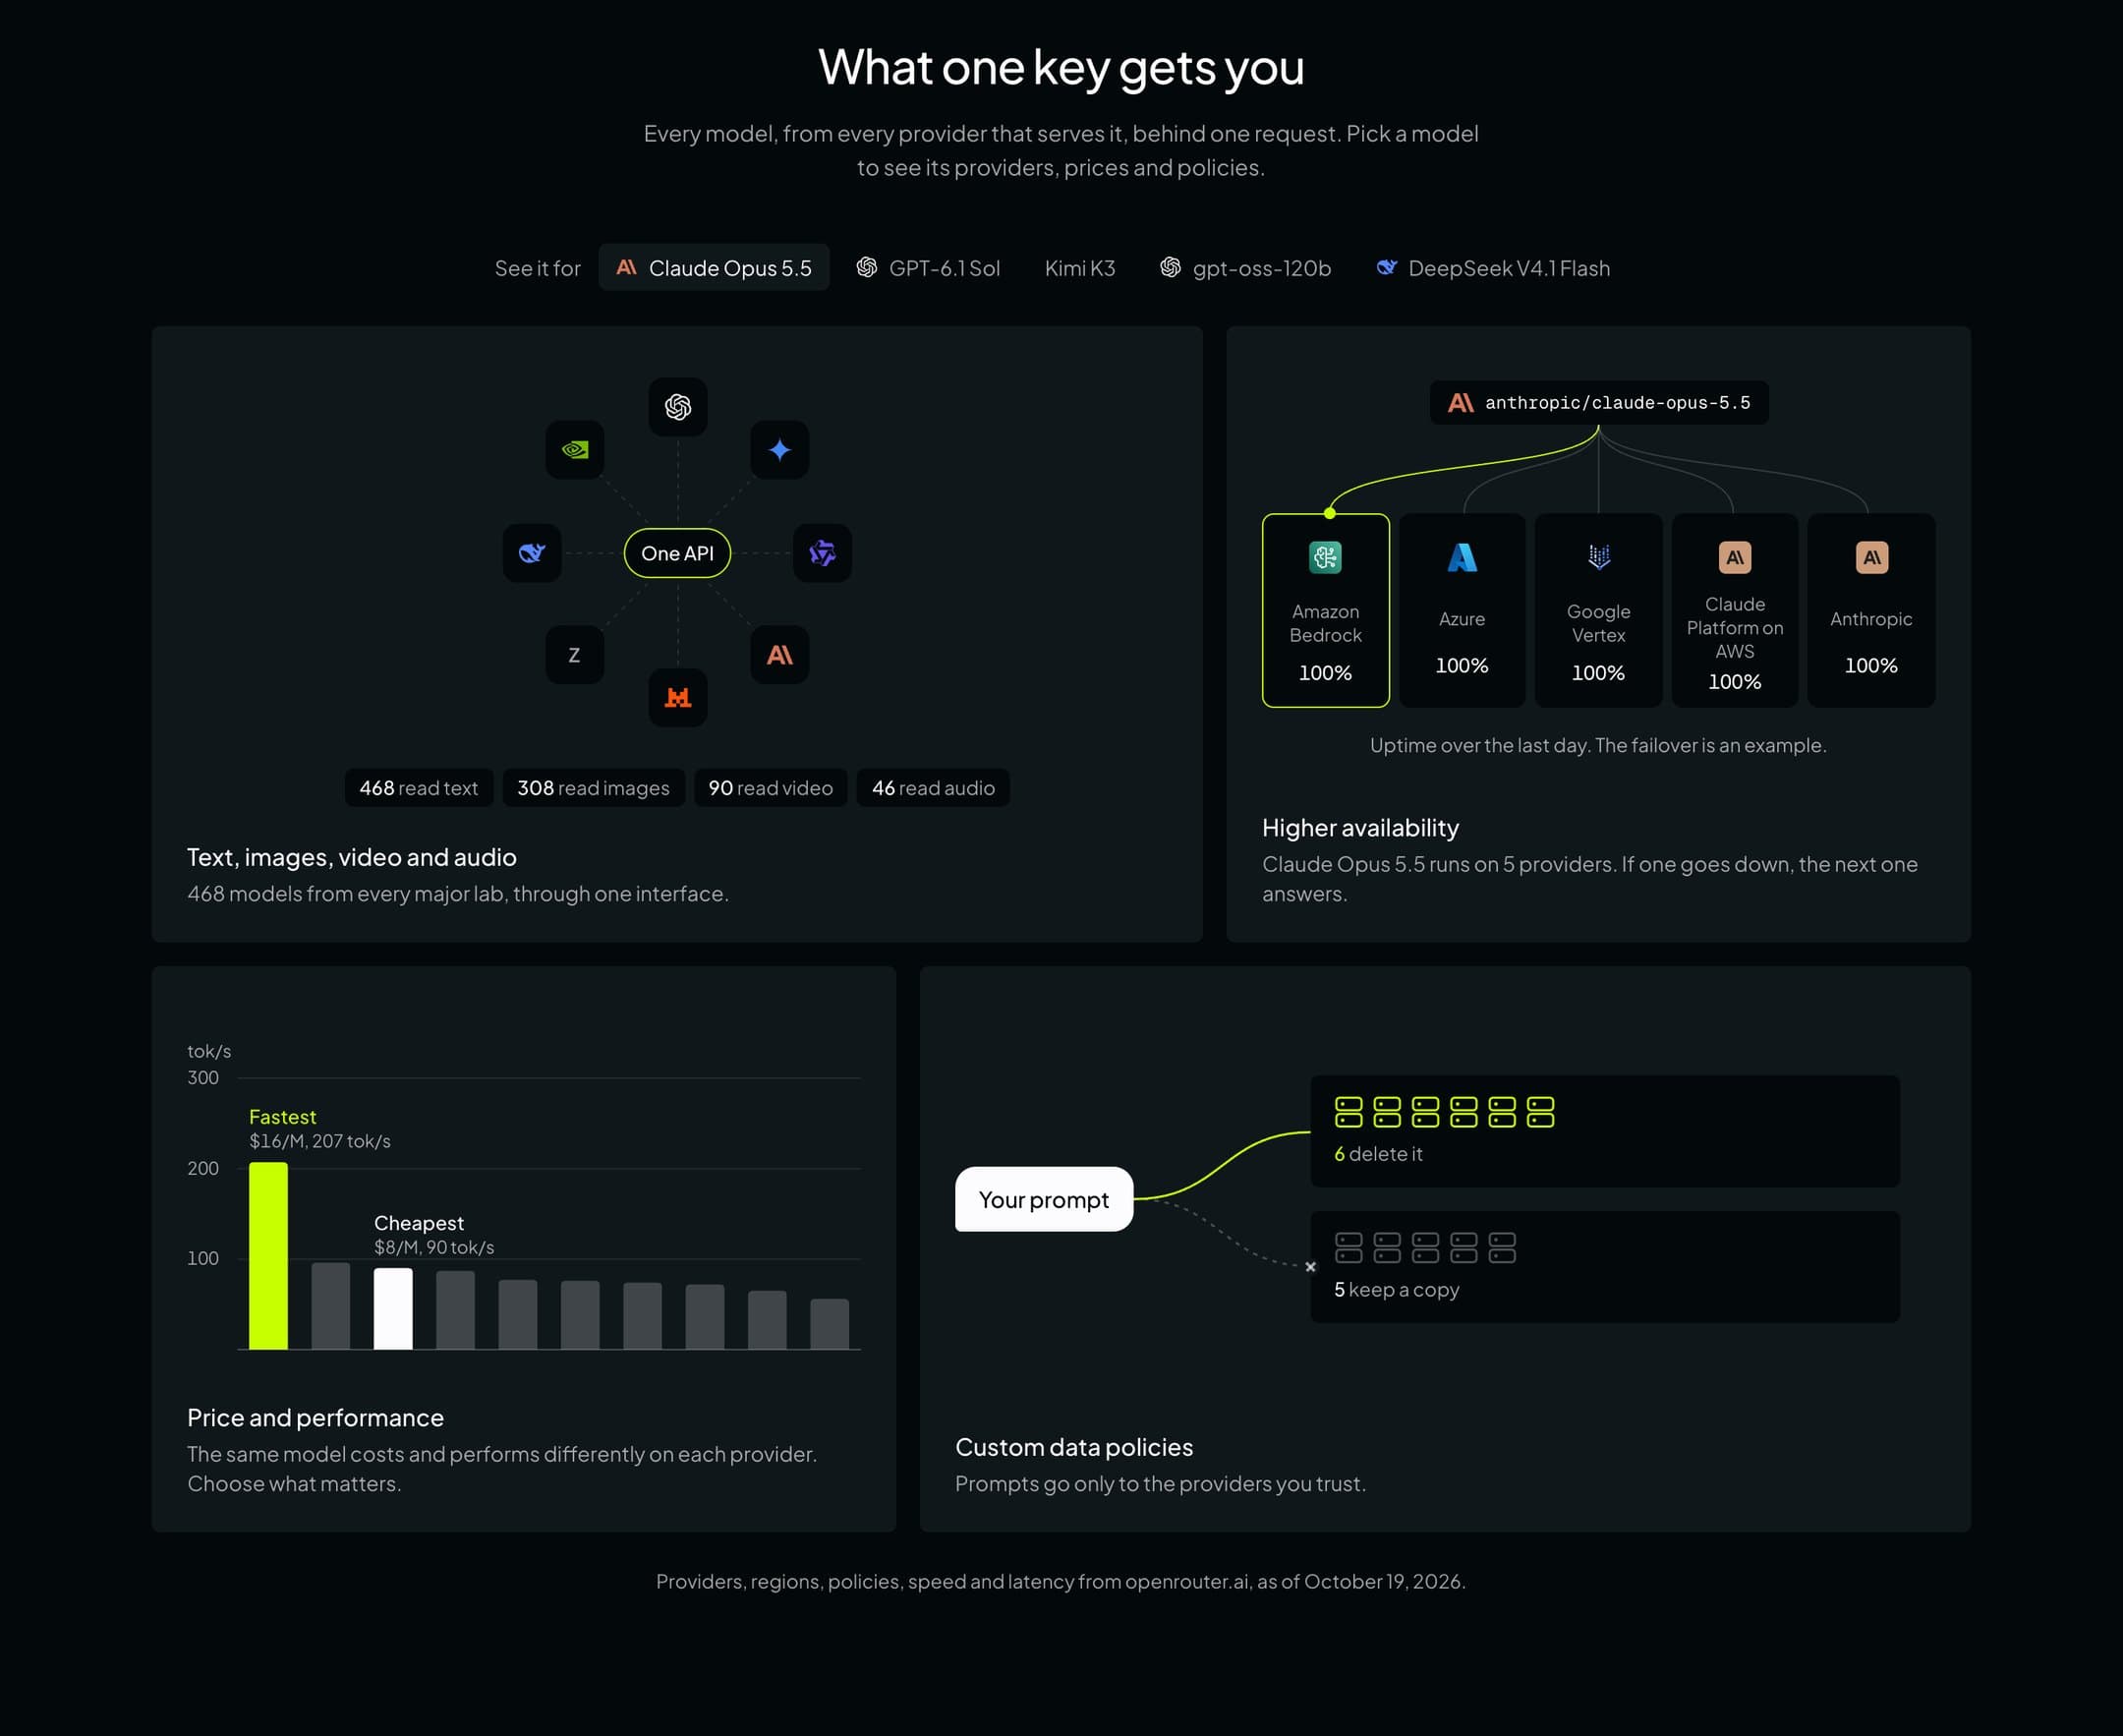
The price and policy cards took six rounds.
Logos first, then plain facts. Nobody reads that. Then line art, then speed as bars and policy as where your prompt goes.
Agents
From a list to a wheel.
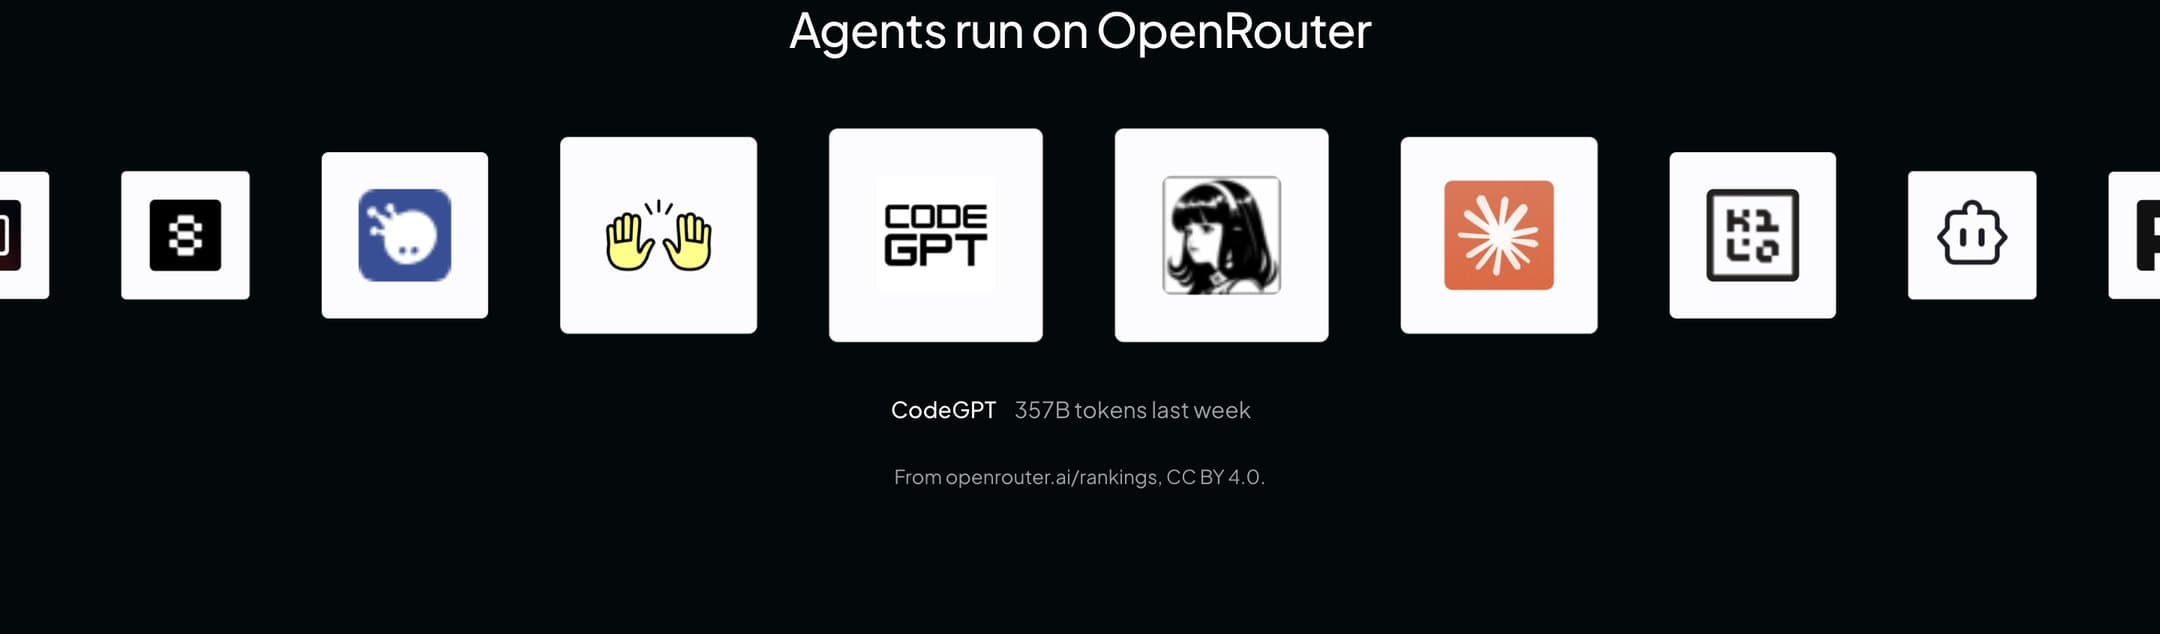
Three takes, a marquee, then a wheel like Granola's: tiles turning past, one name at a time.
Process
Rules first, then cutting.
I wrote the rules down (one accent, no capitals, nothing under 12px) and checked every change with an audit script. Motion came last: four animations, each with a reason.